Impact Measurement at Lind Foundation.
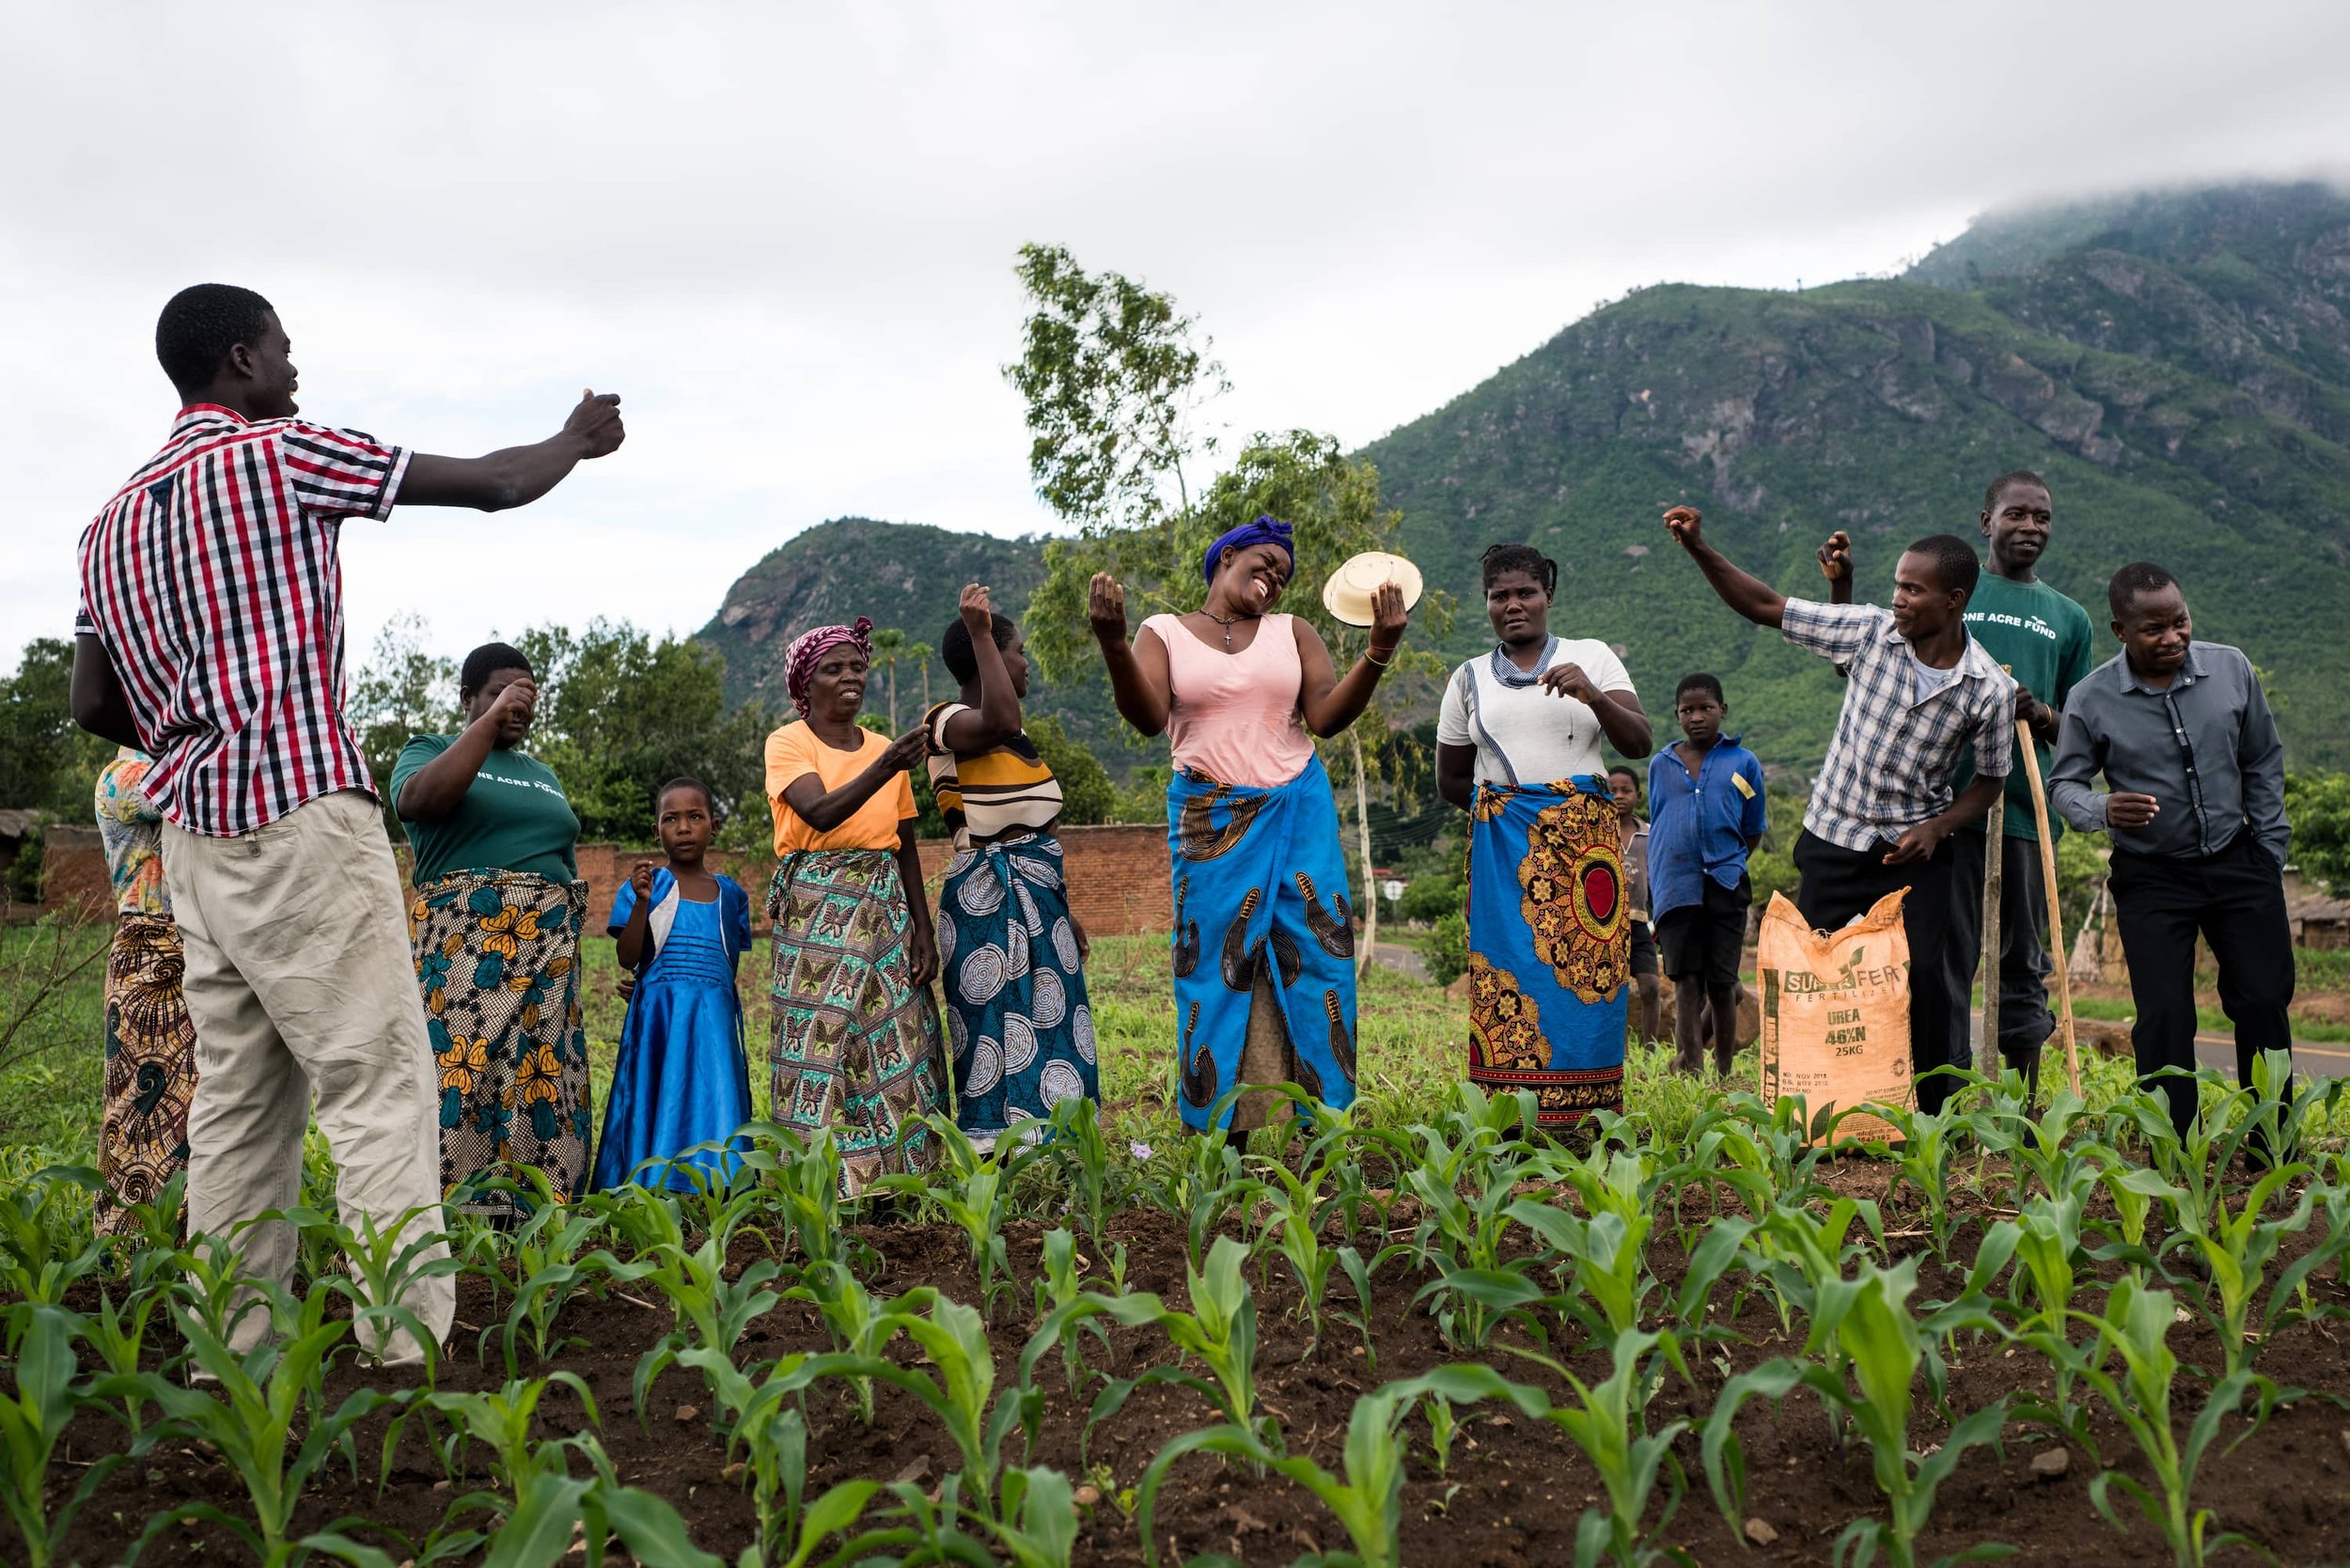
At Lind Foundation, we are engaged in creating persistent improvements in the lives of vulnerable and socially marginalised people while at the same time generating value for society. For that reason, we support organisations and projects that enable people to make the most of their potential. To understand and maximise the impact of these efforts, we rely on impact measurement.
Our first step is to ensure that the change created by the initiatives is genuine and would not have happened otherwise. Measuring impact provides valuable insights into the people, projects, and organisations we work with and most importantly, it allows us to analyse and demonstrate the effects of their efforts.
At its core, impact measurement describes the relationship between what you invest (the input) and the financial and social value that is generated (the outcome). The purpose is not to increase earnings. Rather, it is to ensure that meaningful change can be directly attributed to the initiatives and that the positive effects remain sustainable for the people and communities they serve — both now and in the future.
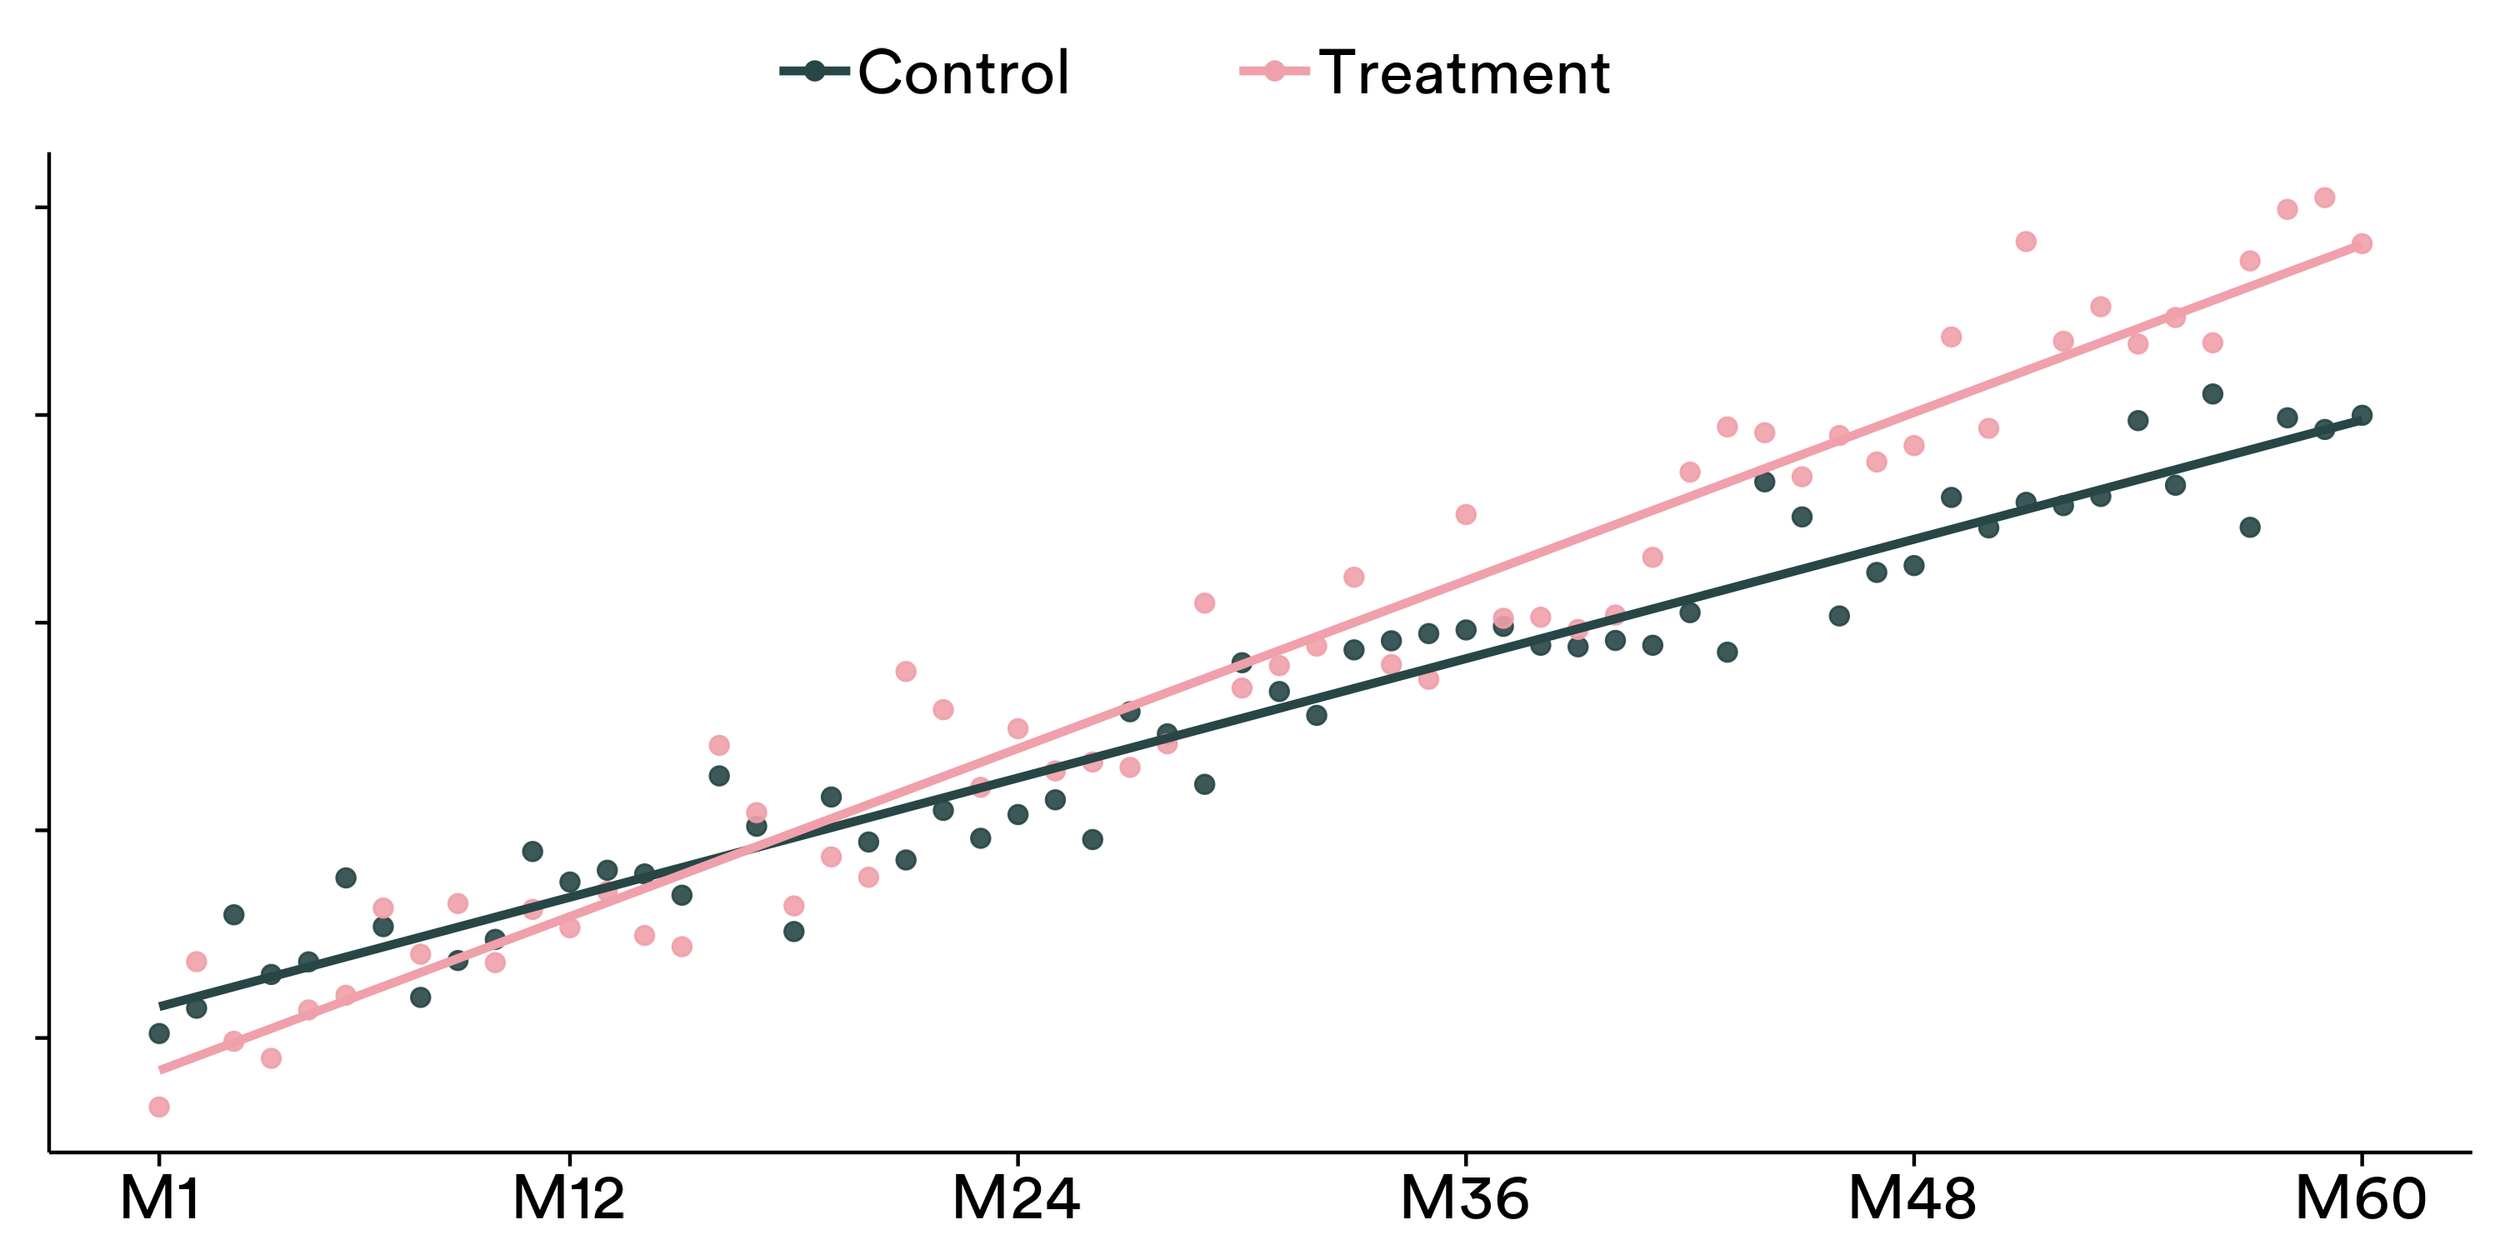
Comparing outcomes over time helps us understand whether change can be attributed to the intervention
Our Approach to Impact Measurement.
For partners, practitioners, and stakeholders who want to understand the principles behind our work, our paper on impact measurement explains how we measure and use impact to strengthen social interventions over time.
A short introduction to our approach.
Our Report Archive.
Explore some of our reports.

Ungebudgetter (2026)
Talents of Tomorrow (2026)